Energy transitions have been an important feature of human history, each new wave helping shape industrial, social, and economic change. From burning wood to harnessing fossil fuels like coal, oil, and natural gas, humanity has continuously shifted its primary energy sources in pursuit of more efficient, abundant, and affordable energy.
Today, the world is undertaking another major energy transition: the shift from carbon intense fossil fuels to renewable and low-carbon energy sources. As technological progress changes the cost structure of industries, we see increasing evidence that the transition is accelerating.
Significant progress with solar energy has solved the problem of producing cheap renewable energy. Despite this backdrop, there has however been a fracturing between what is aspirational and what is realistically achievable. The problems of storage and intermittency remain unresolved. Furthermore, there are certain harder to abate industries such as shipping and air travel that cannot rely on this. Similarly, chemical processes involved in steel and cement production involve pathways that are understood but have yet to reach cost structures or policy support that incentivise their acceleration. This uncertainty has created some highly attractive opportunities for the long-term investor.
The history of energy transitions
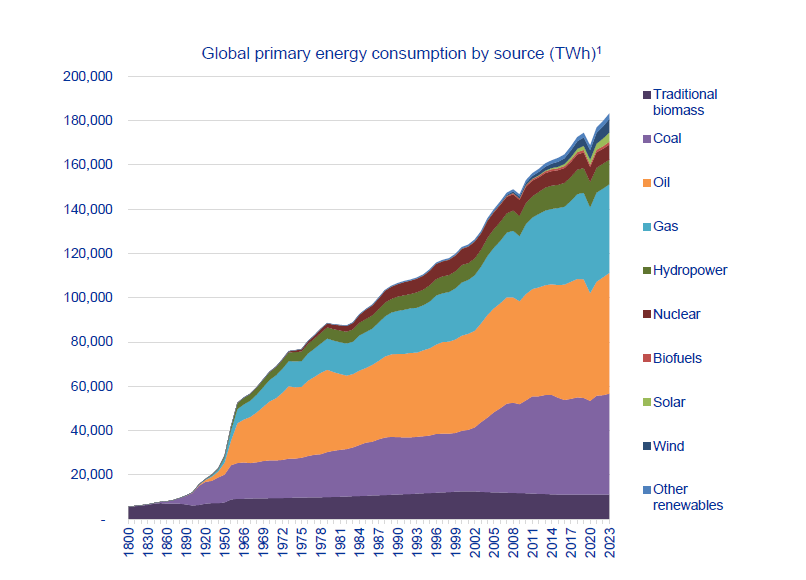
Energy transitions have historically been driven by technological breakthroughs and the increasing demands of expanding economies. The first major shift occurred when societies transitioned from relying on biomass, such as wood, to coal during the Industrial Revolution in the late 18th and early 19th centuries. Coal provided far more energy per unit than wood, making it ideal for powering steam engines, factories and railways, revolutionising industry and transportation.
In the late 19th century, a new transition began as oil and natural gas entered the energy mix. Oil’s higher energy density, ease of transport, and versatility, particularly for transportation, made it the dominant fuel of the 20th century. This era also saw the electrification of homes and industries, thanks largely to coal and hydropower. Each of these transitions took decades, reshaping societies and economies, powered by abundant and cost-effective energy sources.
1Our World in Data; Energy Institute - Statistical Review of World Energy (2024); Smil (2017).
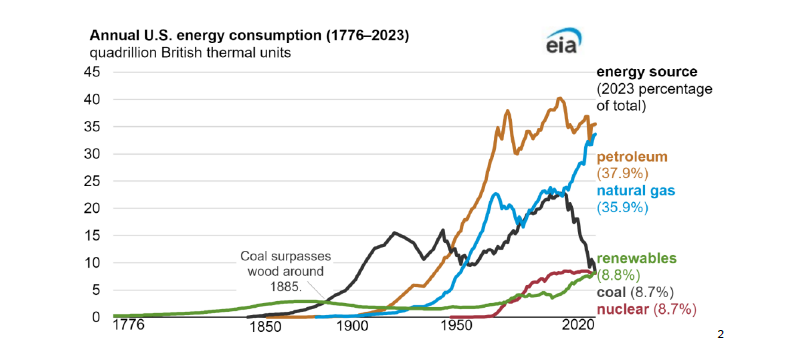
The most recent energy transition in the US has been characterised by coal being replaced by natural gas as the shale revolution has lowered the cost of natural gas in the US from c.$6/MMBtu (Million British Thermal Units) to under $3/MMBtu over the last decade or so.
2EIA.
What we said in 2015
In 2015 as the emerging shift in energy consumption was becoming apparent and the oil & gas industry was reeling from the shock of the first price war between US shale producers and OPEC, we reviewed our outlook for the sector. Our key takeaway from that analysis was that oil growth was likely to continue in the coming decades but could turn negative sooner than consensus was assuming as the fleet of automobiles became more efficient and transitioned to Electric Vehicles. Some of our views at the time were influenced by the Paris Agreement, reached in that year.
In terms of the transition of the electric grid we assumed and continue to assume demand for electricity would grow at 3-5% per annum. However, some assumptions were off the mark such as our views on coal which has remained much more prominent than we expected and the adoption of solar that has been slower to be adopted.
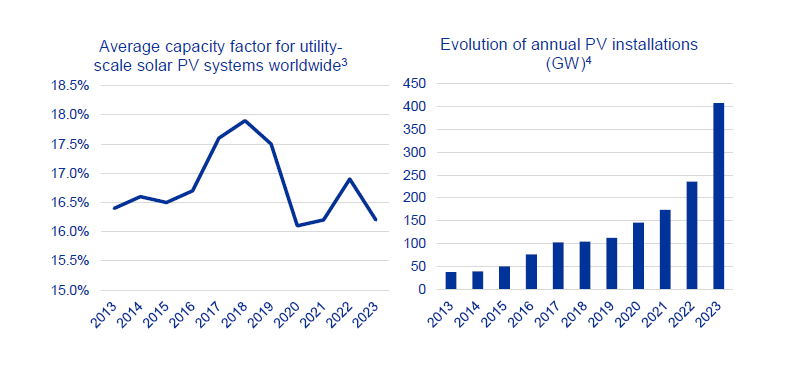
Solar instillations evolved broadly as we expected and grew at a relatively predictable rate driven by technology improvements and growing productive capacity. However, load factors fell slightly as the falling cost of solar incentivised installations in less productive locations, including higher latitudes and rooftops, both of which on average generate less solar than the original locations such as deserts.
3IRENA. (September 24, 2024). Average capacity factor for utility-scale solar PV systems worldwide from 2010 to 2023 [Graph]. In Statista.
4International Energy Agency: Snapshot of Global PV Markets.
Looking forward
Having reviewed the current position and what we assumed a decade ago, we have considered what has changed since then and what will alter the course of the transition.
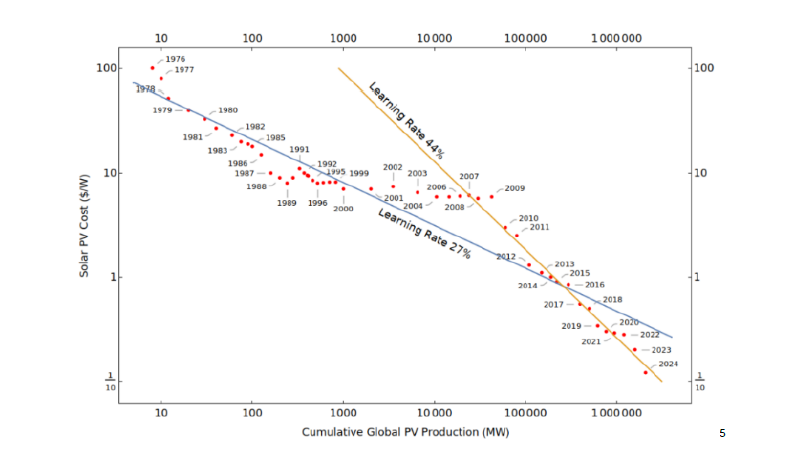
Some of the drivers of the transition are somewhat predictable such as the continued cost declines of new technologies that will drive adoption over the long run. This remains especially true for solar which has seen a cost decline of around 30% per annum on a per gigawatt (GW) basis over the last decade. We expect this to continue. This has two impacts: it makes solar energy competitive in more markets and in existing markets each dollar invested yields more energy output than a dollar spent on solar a decade earlier.
6BNEF.
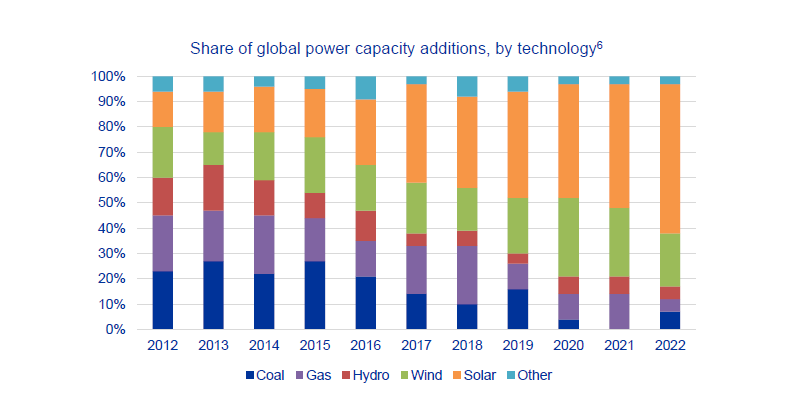
This decline in the cost of solar has meant it now represents 60% of each megawatt (MW) of energy installed, up from 20% a decade ago.
The intermittency problem
Energy produced from solar panels has fallen to a cost where it is the cheapest source of energy, but it needs to be consumed at the point of production unless it can either be stored or distributed. This must be managed with extra costs for either storage, backup power alternatives or distribution.
Many industry participants refer to levelized costs of energy (LCOE) when comparing energy sources and we agree this is a helpful tool. The LCOE is the average cost of generating electricity from a specific energy source over the lifetime of a project. However, LCOE is not an appropriate benchmark without appropriate storage or back up capacity and does not account for associated increased transmission costs of a distributed system - all necessary to balance the grid.7
The most likely source of storage is chemical batteries, but the cost declines for batteries have been relatively mild, with annual rates of improvement around 5-10% per annum.8 We may find ourselves in a position where we are able to extract a lot of cheap solar energy but unable to get it to where and when it is wanted.
Dunkelflaute -"dark doldrums"
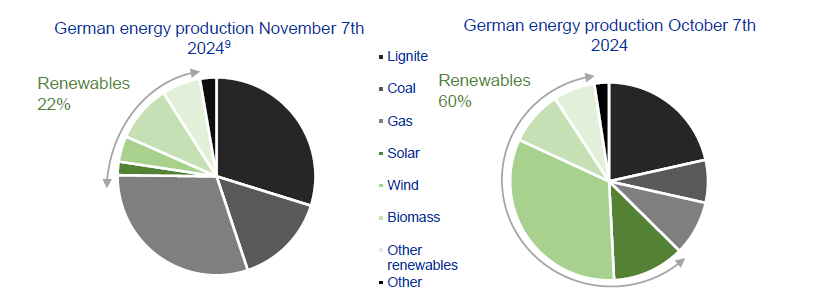
Germany, one of the leaders in renewable adoption, is a case in point. At the peak of renewable energy generation, it can produce more energy than is needed for 100% of demand. However, in the first week of November northern Europe descended into a dull, still period of weather. The wind did not blow, and the sun did not shine. Germany has even added a word to its vernacular, “Dunkelflaute”, to describe such events.
Germany’s c.150 gigawatts of installed renewables were of limited use, providing 22% of energy compared with closer to 60% on a more normal day. Whilst the 1.8-gigawatt hours of battery capacity is around 0.1% of the average daily energy consumption of 1.3-terawatt hours. As a result, for a weeklong period Germany again became dependent on fossil fuels.
7J.P. Morgan 13th annual energy paper Numbers in, Garbage out: the practical irrelevance of “levelized cost of energy” for wind and solar power. March 28, 2023.
8Cole, Wesley and Akash Karmakar. 2023. Cost Projections for Utility-Scale Battery Storage: 2023 Update. Golden, CO: National Renewable Energy Laboratory. NREL/TP-6A40-85332. https://www.nrel.gov/docs/fy23osti/85332.pdf.
9Energy Charts by Fraunhofer ISE: www.energy-charts.info
This makes the next phase of forecasting energy supply more complex; it appears that the problem of renewable energy production has likely been solved through solar but storing and transmitting it has not.
What does this all mean?
Global energy investment is set to exceed $3tn for the first time this year with nearly half of that in clean energy technologies and infrastructure. Solar, which is by far the biggest part of the renewable mix is c.$500bn. However, there has been no noticeable increase in the investment in grids and almost no investment in battery storage. Policy can help drive technology adoption and create frameworks to enable adoption but ultimately it is technological discovery that helps drive prices down to competitive levels.
We expect energy production from solar, and to a lesser extent wind, in the coming years to grow exponentially from a low base but the problem of storage remains unresolved. Many forecasts assume that by 2030 renewable resources will be cost competitive with a storage addition, but this only includes four hours of additional storage capacity.
Current behaviour from large technology companies, who are desperate for incremental supply of energy is informative – nuclear and gas appear to be the sources of energy currently being used to power the artificial intelligence (AI) boom rather than solar with batteries. The cost of having battery storage for multiple days makes this solution prohibitively expensive when compared with traditional sources.
We believe there is still significant room for efficiency improvements in renewable energy. As these technologies become cheaper, their deployment will accelerate. We are confident that the transition will happen, however, we also recognise that hydrocarbons will play a role for decades to come. We want to see energy companies strike a balance between returning capital to shareholders and investing in new technologies where appropriate and will monitor and engage with them along the journey to net zero. At current valuations, these companies are delivering substantial cash returns through double-digit buybacks and dividends and as such offer meaningful excess returns for the patient value investor.


