US equities have had a great run, beating every other major asset class over the last decade. In real terms, the S&P 500 delivered annualised returns of 9.6% over ten years, well above the 100-year trend of 7.4%. This means that the cumulative real return over the last ten years has been 150%, compared with an average ten-year return of 104%. A breakdown of the return into its component parts shows that this outperformance has been entirely driven by an expansion in valuation multiples. If valuations had not changed, US equities would have delivered 5.5% real returns over the last decade – slightly below long-term trends.

Real returns in USD.
Source: Robert Shiller via http://www.econ.yale.edu/~shiller/data.htm, Oldfield Partners.
We believe one of the best indicators for a market’s future return potential is the cyclically adjusted price-to-earnings ratio (“CAPE”). Unlike the traditional price-to-earnings ratio, CAPE uses average earnings generated over the preceding ten years and adjusts them for inflation. This averaging makes CAPE less susceptible to cyclical peaks and troughs in earnings. Over the last decade the CAPE of the US market has expanded from 27 times to now 38 times. This compares to a 30-year average of 28 times. One can easily draw longer or shorter-term averages, but we believe the 30-year one is particularly relevant because the long-term treasury rate, a key driver of equity values, averaged 4.3% over the period, not far off today’s 4.5%.
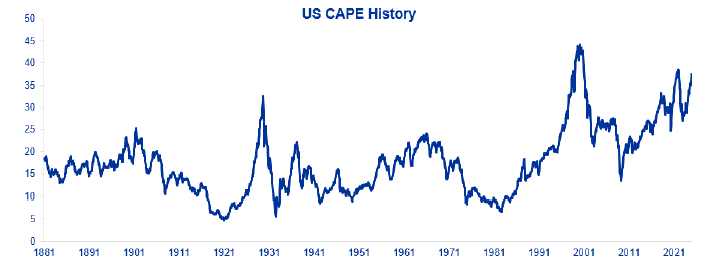
Source: Robert Shiller via http://www.econ.yale.edu/~shiller/data.htm,https://www.multpl.com/shiller-pe.
What this high level of CAPE means for investors is best illustrated by the chart below. Each dot represents a starting CAPE for the US market, and it shows the subsequent 10-year annualised real return. The chart illustrates that the market has rarely been as expensive as today, and the market has never generated a positive real return over the subsequent decade when it traded at such valuation levels. The dataset covers over 140 years of history and it clearly shows that valuations and returns are two sides of the same coin. We are confident that the answer that CAPE gives us is not an outlier or driven by some quirk in the data. Every single long-term valuation metric that we have seen points to the US being in bubble territory.
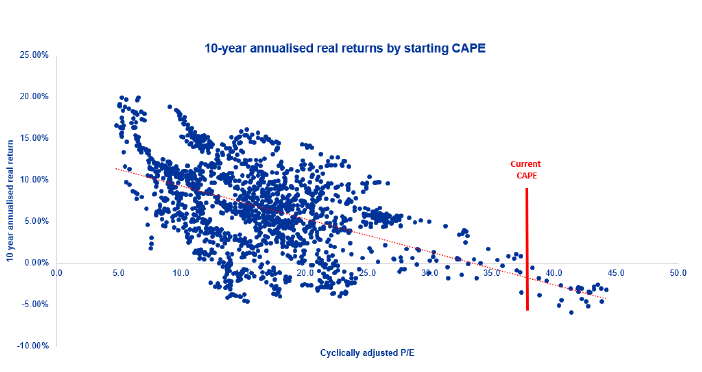
Data from 1881 to 2024. Real returns in USD.
Source: Robert Shiller via http://www.econ.yale.edu/~shiller/data.htm.
The belief that US equities can deliver huge levels of growth to overcome this problem is unrealistic. We believe the opposite to be true: real earnings growth seen over recent decades is not repeatable. The table below from the Fed’s Michael Smolyansky shows that non- financial companies in the S&P 500 grew real earnings per share by 2.0% per year between 1962 and 1989. From 1989 to 2019 this has accelerated to 3.8%. Over the same periods growth in real EBIT per share has decelerated from 2.4% per year to 2.2%. Importantly, over both periods, EBIT has grown by less than GDP. How come earnings growth accelerated over the last 30 years while EBIT per share growth did not? The answer is that the entire outperformance at the earnings level came from falling interest rates and taxes, and rising levels of debt. With effective taxes of the S&P firms at 17% in 2022 and interest rates still at historically low levels, this tailwind will not get repeated. Any investor who believes that the market can grow real earnings by more than real GDP over the long term is almost certainly over-optimistic.
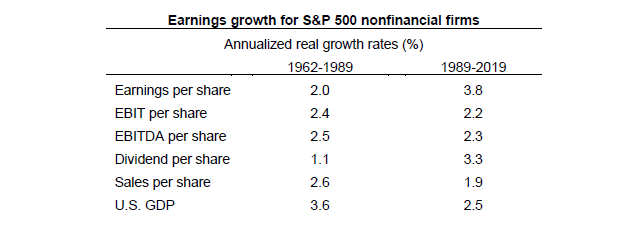
Source: Smolyansky, Michael (2023). End of an era: The coming long-run slowdown in corporate profit growth and stock returns," Finance and Economics Discussion Series 2023-041. Washington: Board of Governors of the Federal Reserve System, https://doi.org/10.17016/FEDS.2023.041.
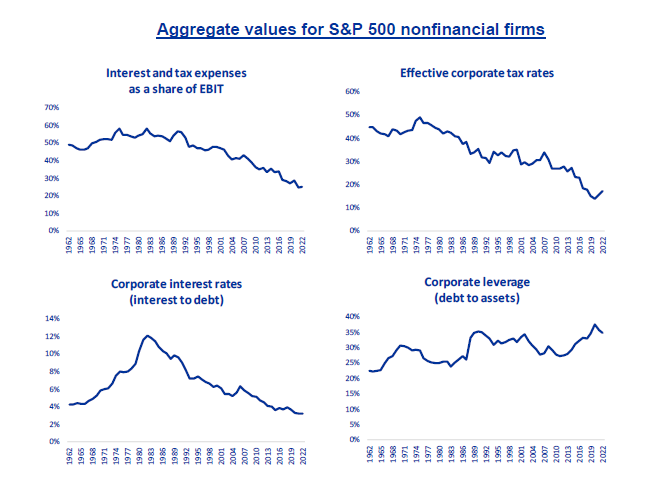
Source: Smolyansky, 2023.
So what level of returns can US investors expect over the coming the decade? We will break it down below:
- Valuation: If the CAPE returned to its 30-year average level of 28 times, this would represent a 2.9% annual headwind from valuations.
- Earnings growth: History suggests that EBIT per share growth in line with GDP would be a good outcome. There is little room for a further aggregate drop-in interest rates and taxes, hence earnings per share growth may also grow in line with GDP. Most forecasters point to real medium-term US GDP growth of around 2% which we will use for our purposes.
- Dividend yield: Assuming the S&P holds its dividend in absolute terms, a drop in the valuation to 28 times CAPE would take the dividend yield to 1.7%.
Putting the three elements above together, a reasonable estimate for the real return for US equities over the coming decade is at 0.7% per year– slightly better than the CAPE dot-chart suggests, but hardly worth writing home about. The good news for investors is that the US is an exception. As the chart below illustrates, many international markets are trading at a discount to their historic CAPE levels and hence offer higher prospective returns.
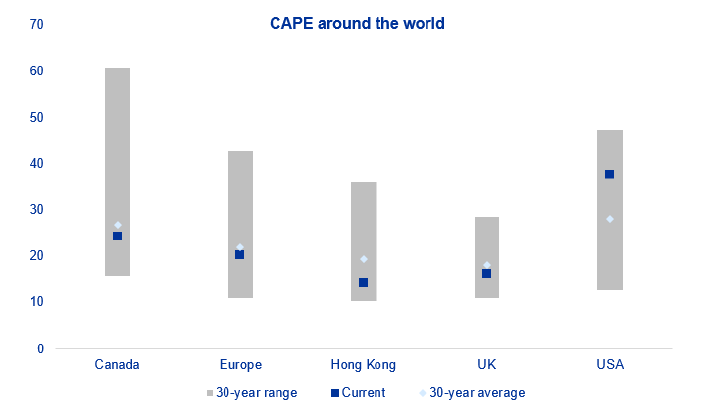
Source: Barclays, https://www.multpl.com/shiller-pe, Oldfield Partners.
At Oldfield Partners we continue to find pockets of value in the US through our bottom-up, research-driven approach, but we believe any equity investor in the market should be highly selective. The strategies we manage are dominated by equities outside the US given their relative and absolute attractiveness. All our strategies trade on price-to-earnings multiples of eight to ten times and based therefore on the indicators described, we believe we are well set to deliver significantly for our clients in the coming years.


