A frog when thrown into a vat of boiling water will jump straight out. However, if placed in the pot at room temperature, the frog will be heated up gradually and it will end up being boiled alive.
Although this may not be a scientifically accurate description of how frogs behave, it has been used as a metaphor to describe how humans act when facts change slowly, rather than suddenly.
The metaphor can be extended to markets. 1999/2000 saw valuations boil to extremes. The last decade has seen them simmer slowly, up to very high temperatures.
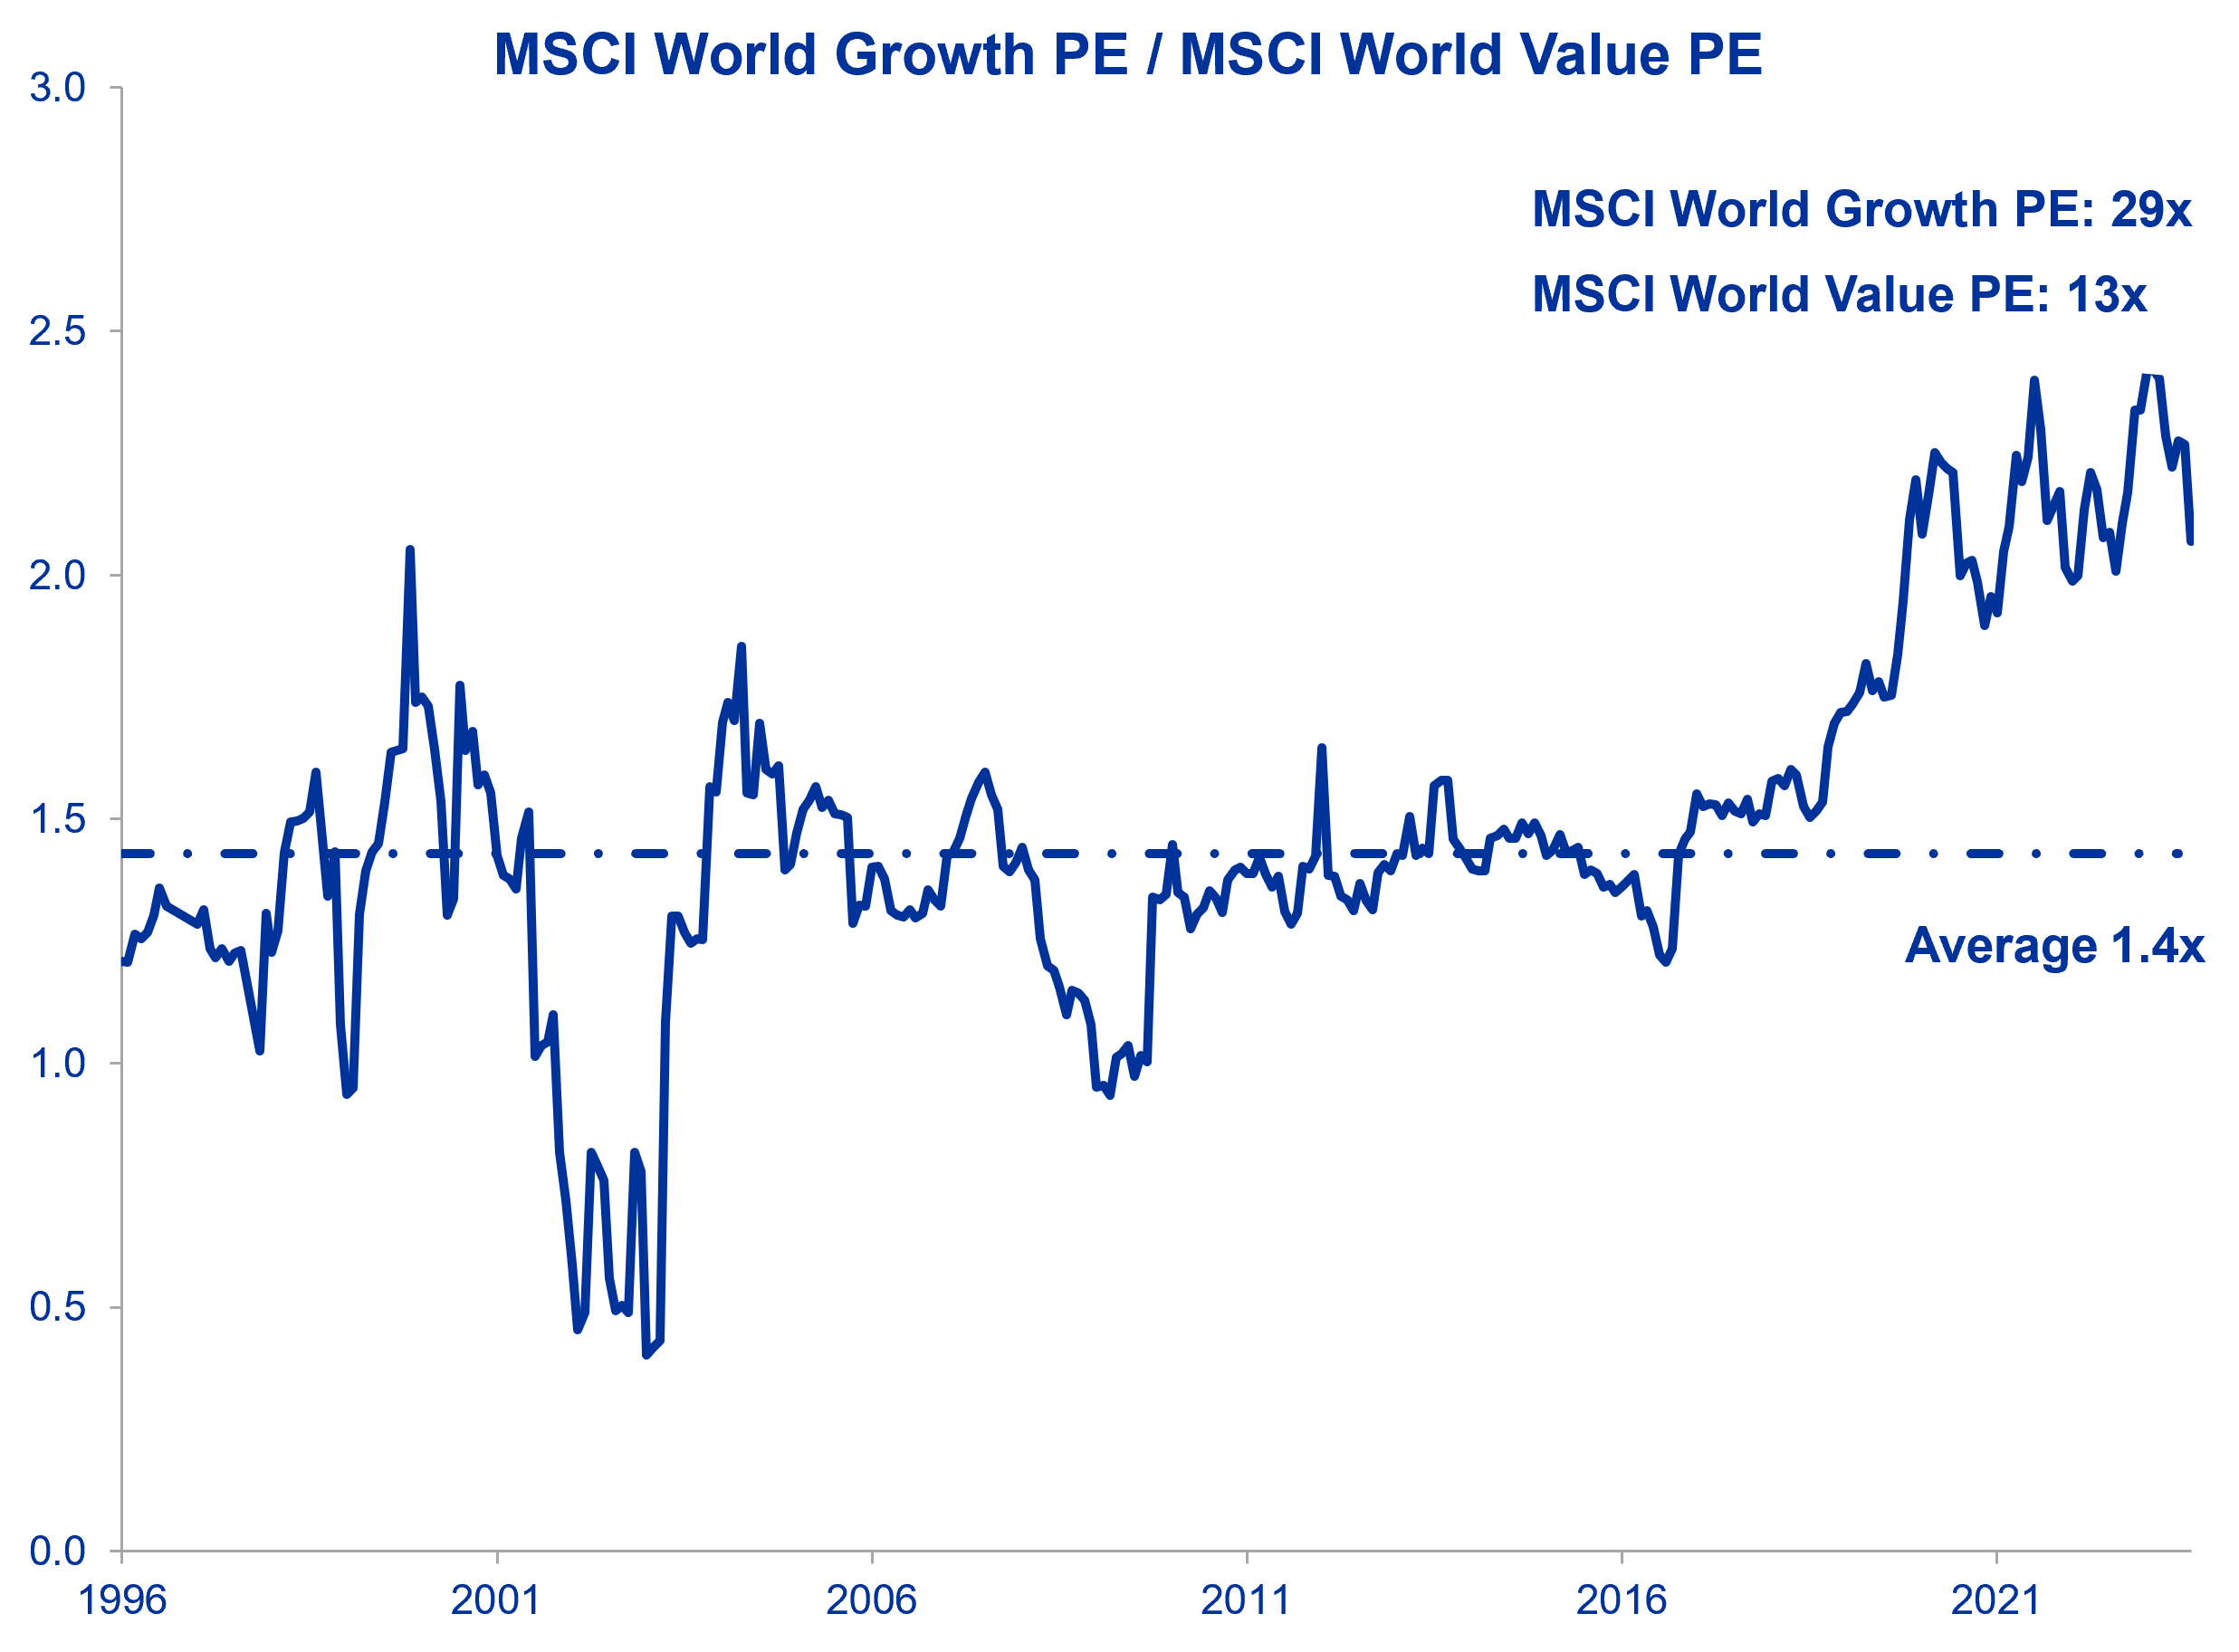
In 2000 the MSCI World Growth Index peaked at around 47 times price to earnings, having rerated from 28 times over the previous two years. This had all the hallmarks of a bubble. Today the MSCI World Growth Index trades at 29 times price to earnings. It has rerated from 20 times, but this has taken much longer - a decade. The total re-rating is of a similar magnitude. However, as this occurred over ten years rather than two, it means the feeling is not quite the same.
On the other hand, the MSCI World Value Index peaked at around 20 times price to earnings in 2000. Today this index trades at 13 times price to earnings and it has not re-rated over the last decade. The consequence is that MSCI World Growth trades at a near record premium to MSCI World Value.

Source: OP, Bloomberg. Date: as at 31st December 2023
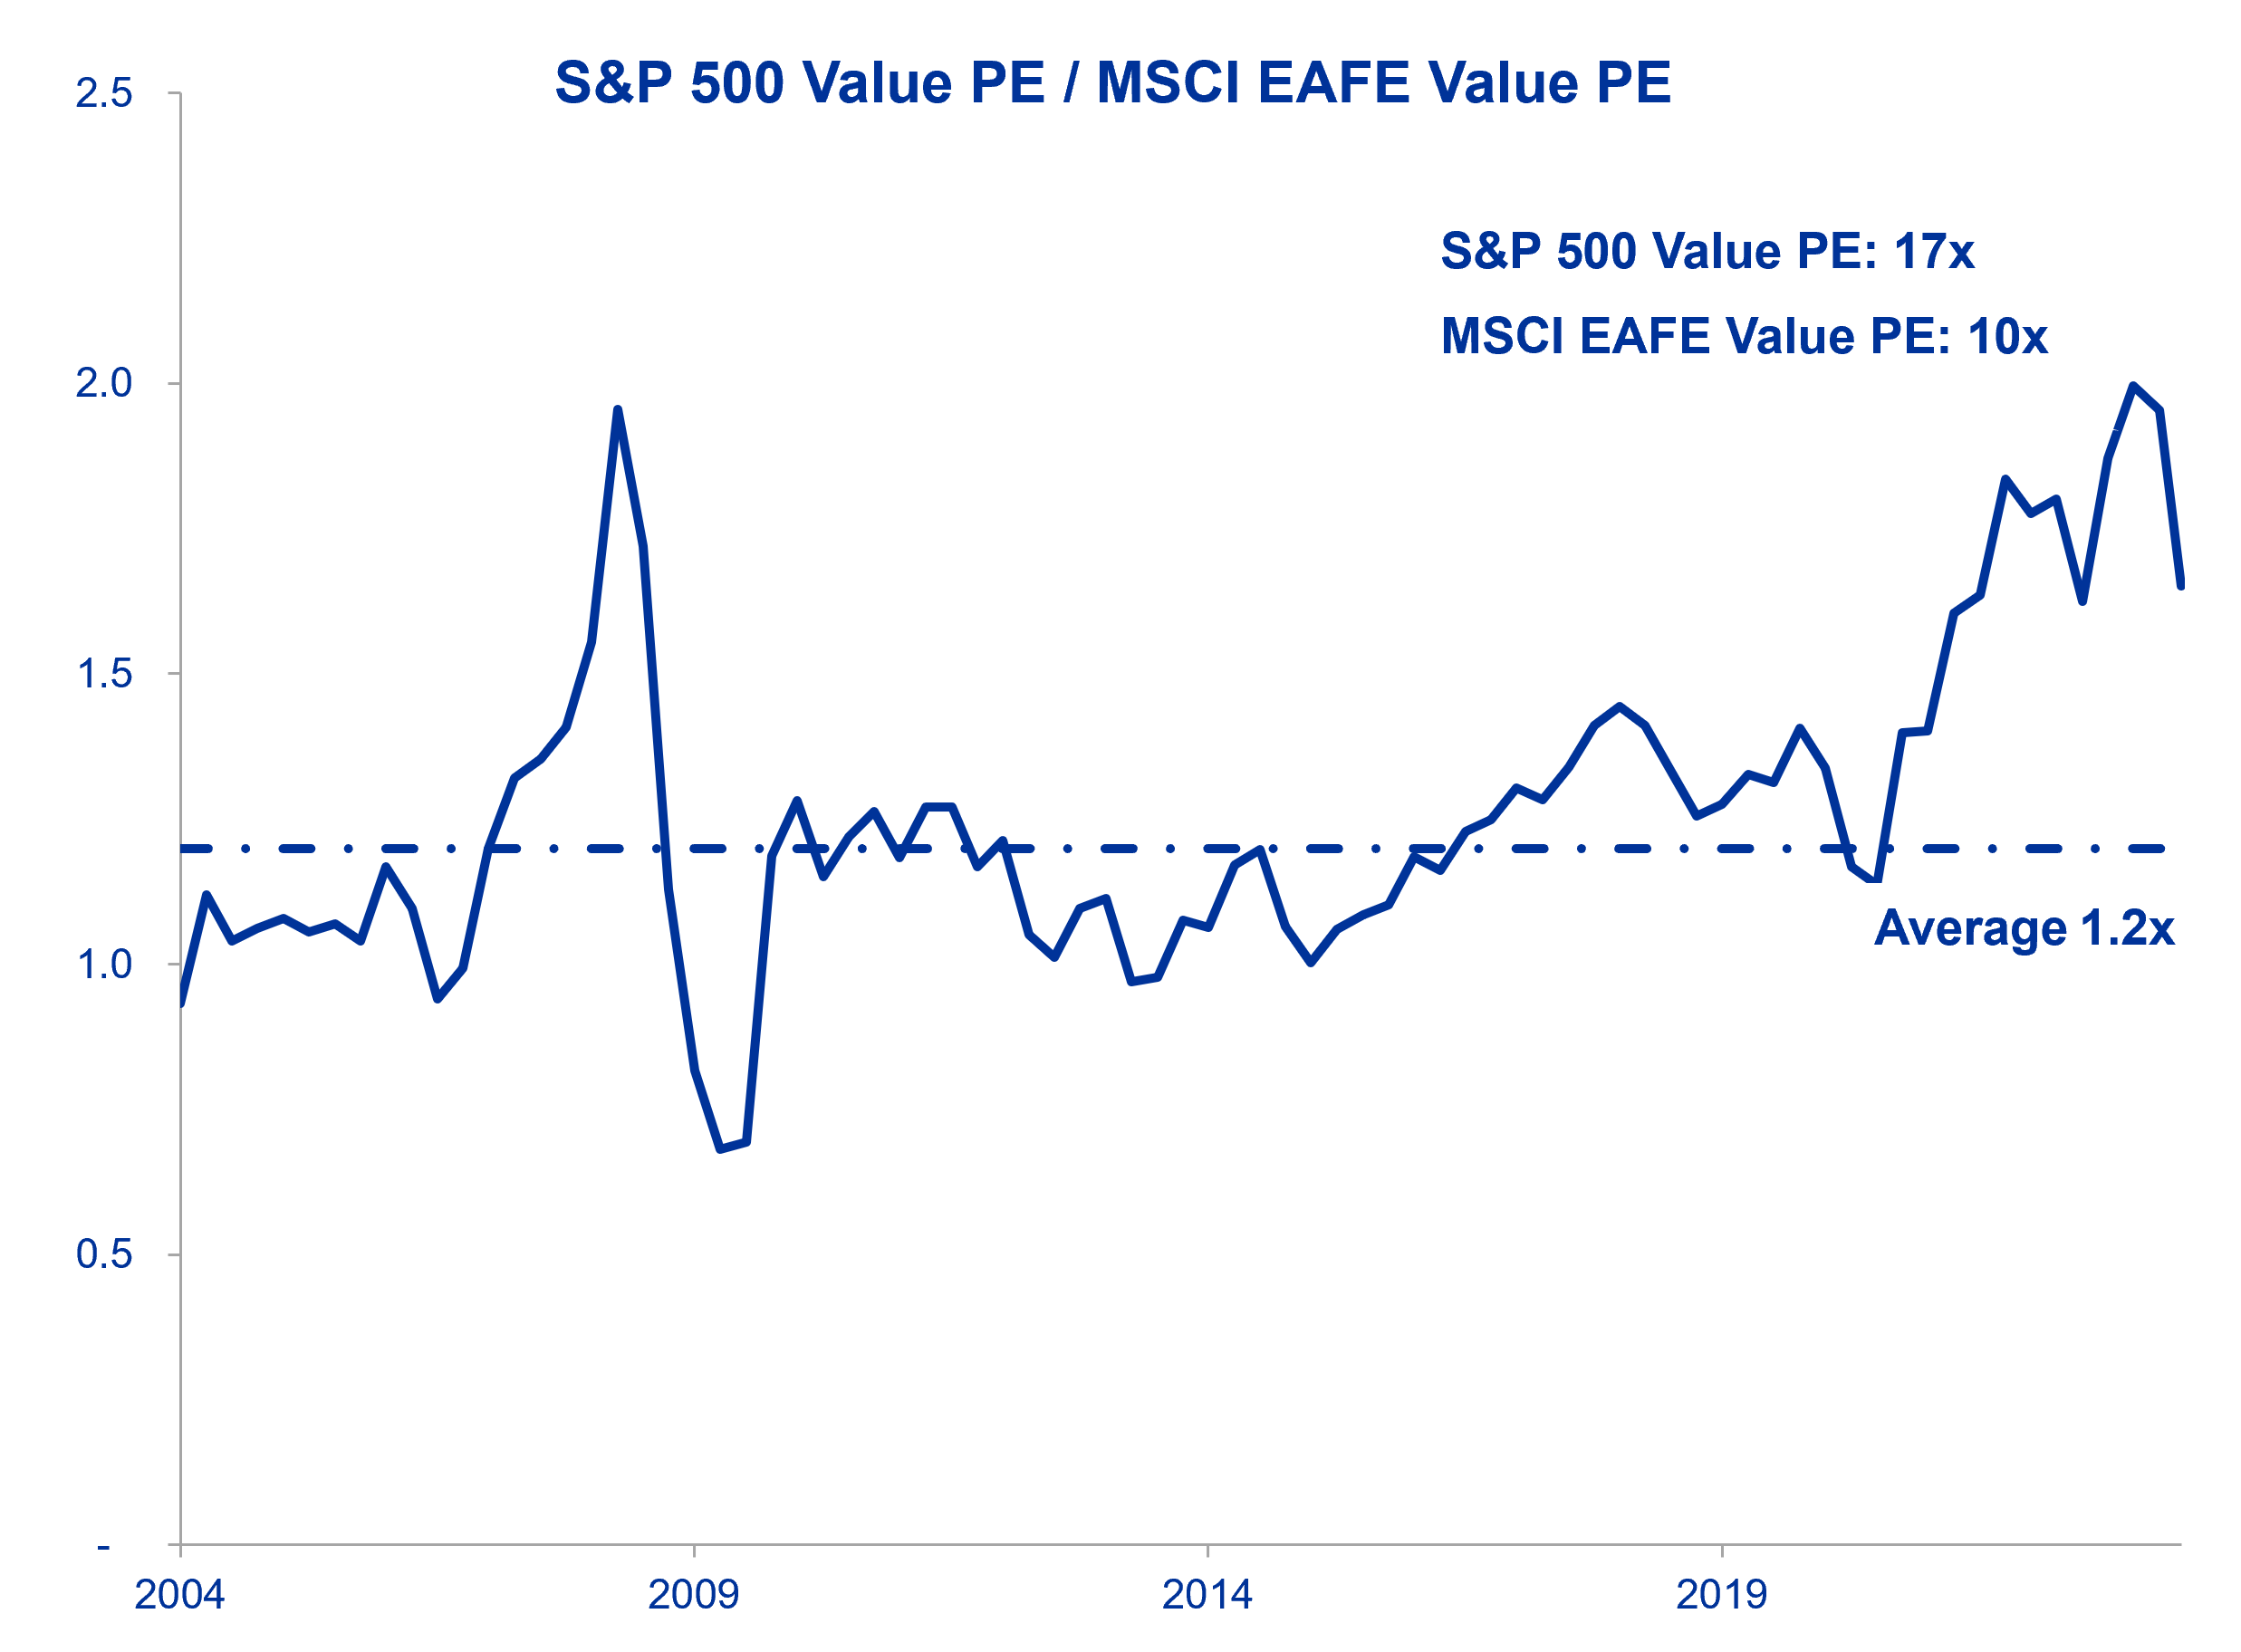
Another ratio that has diverged over the last decade includes the US versus the non-US valuation. When comparing the regions, we look at S&P 500 Value and the MSCI EAFE Value to adjust for the bias to growth stocks in the US market. Looking at these two indices you can see that the S&P 500 Value PE usually trades at a premium of 1.2x over MSCI EAFE Value, but this has widened to close to 2.0x; a record looking back over the last couple of decades.

Source: OP, Bloomberg. Date: as at 31st December 2023
Ultimately both anomalies have taken a near decade to reach current levels, with the divergence beginning in the middle of the last decade and accelerating in 2020, post Covid. Bubbles that emerge quickly such as the Dotcom boom and bust are noticed by all and so the frog jumps out of the hot water. Whereas when valuation extremes develop over a long-time, investors are almost unaware of how far it has gone, become used to the new normal, and complacent in the process. It leaves them at risk of being boiled alive.
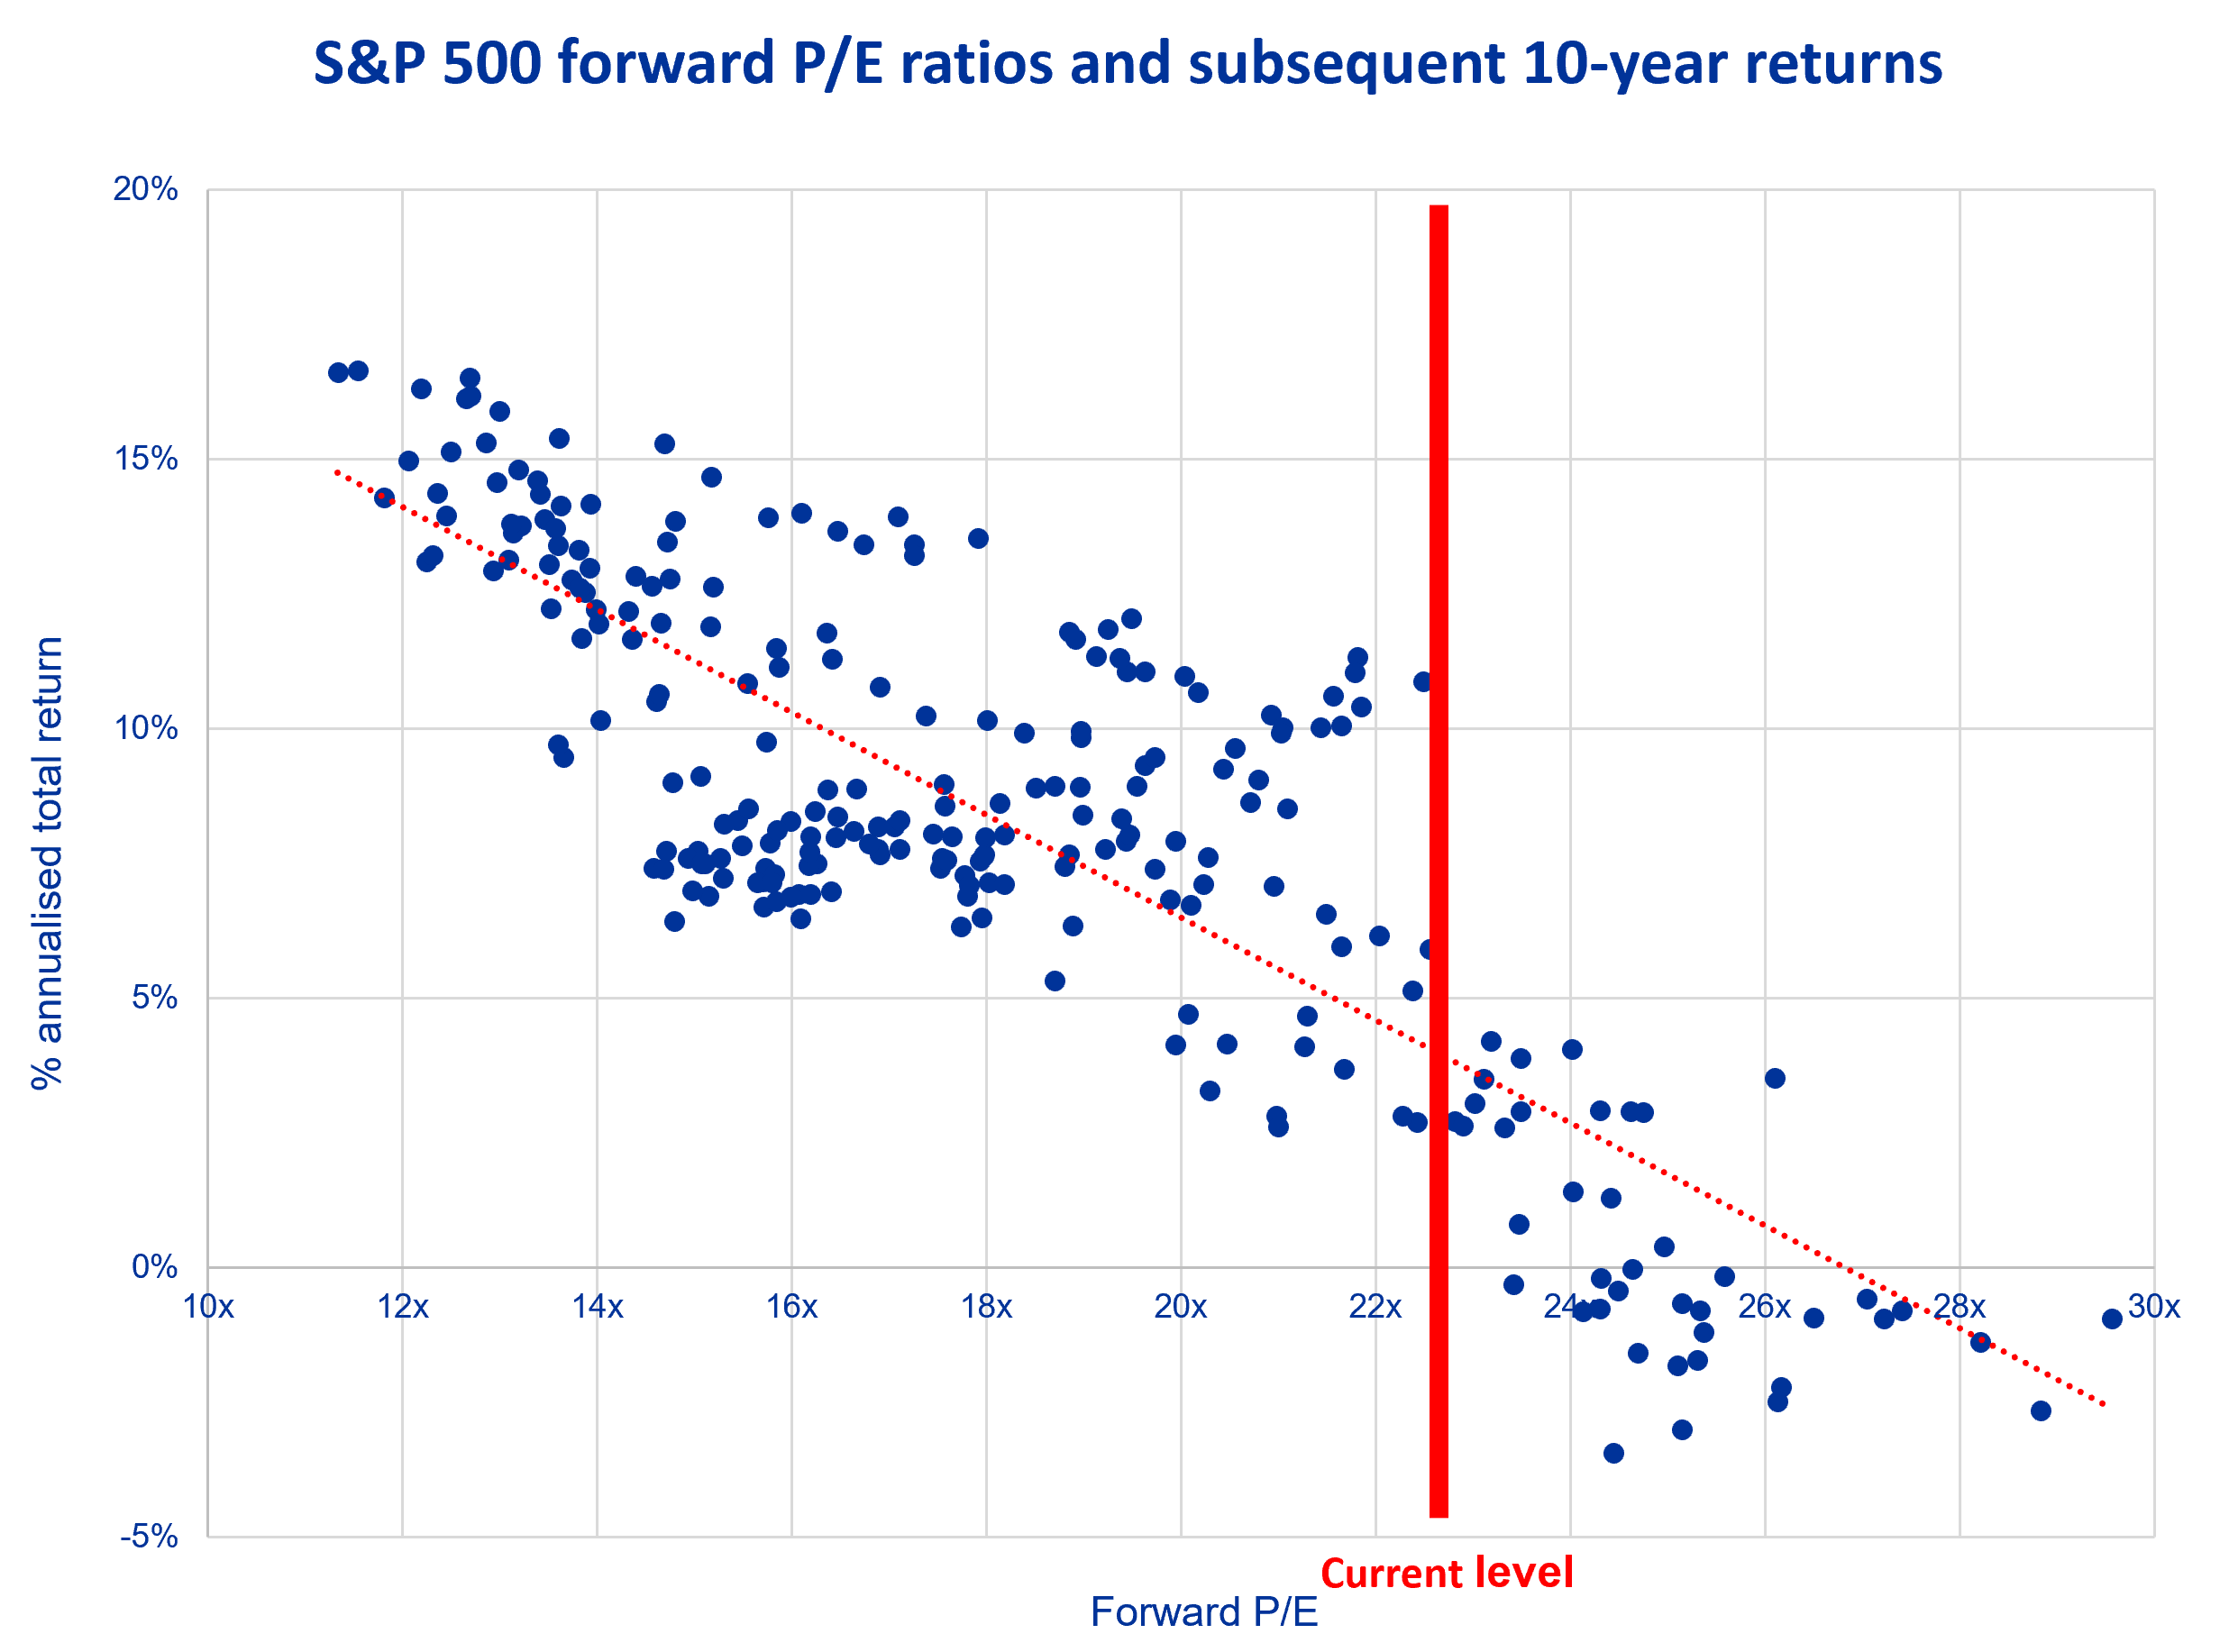
The performance of relative valuations tends to mean revert over time. If they do so on this occasion, there is a substantial opportunity for Value and Non-US assets to outperform. The below chart shows that from current valuations the likely 10-year annualised returns for the S&P 500 are no better than 5% per annum compared with nearly 13% per annum over the last decade.

Source: OP, Bloomberg. from 1993 to 2023 (monthly datapoints).
Why these divergences have emerged is anyone’s guess. It may be linked to the effect of passives and indices on markets. The relative overvaluation in large-cap growth stocks has created an ‘anti-bubble’ in all corners of the market that don’t fit this category. As a result, the Overstone Global Equity Income Strategy today is finding many new ideas, has a Price to Earnings multiple of 10x, a record discount of over 50% to the MSCI World and has a near record upside of 70%.


